About Soundscapes of Alaska
About This Site
This site was created to showcase soundscapes from National Parks across the Alaska Region . Raw audio was collected by the National Park Service Natural Sounds and Night Skies Division (NSNSD) as part of their Type 1 Acoustic Monitoring Data. (How does NSNSD measure sounds?) Specific clips were then manually selected and edited. Special thanks to Halyn Betchkal for picking out these (and many more) audio highlights over the years.
With these recordings, we finally have the answer to the age-old question: "If a tree falls in the woods and no one is around to hear it... it may have been recorded!" For example, hear a tree fall at this Denali monitoring site recording.
How to Read a Spectrogram
Each audio clip on this site includes a spectrogram: a picture of sound broken down over time and frequency. On a clip's page, use the position slider below the spectrogram to move through the recording, or use the keyboard shortcuts listed in the player (arrow keys to seek, Space to play or pause). You can also click a point on the spectrogram to jump there with a mouse.
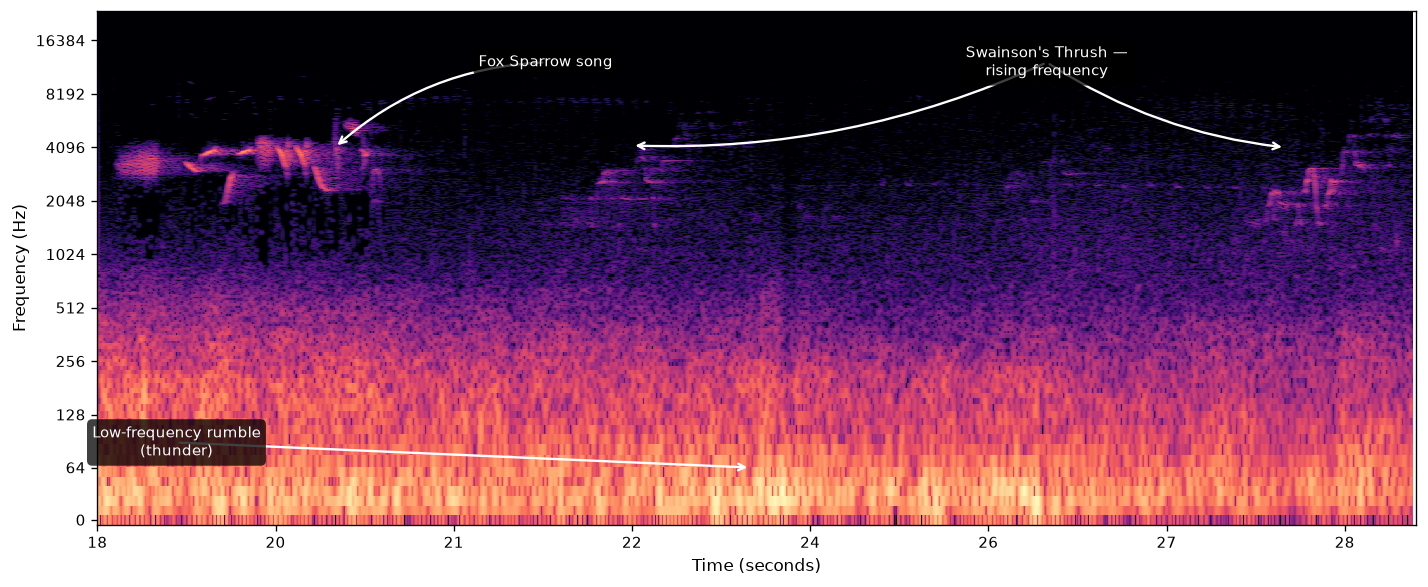
- Time increases left to right.
- Frequency (pitch) increases bottom to top.
- Brightness shows how energetic (loud) a certain frequency is at that point in time.
- A few examples from the above spectrogram:
- Low-frequency rumble (like thunder or wind) fills the bottom frequency bands of the spectrogram as a continuous, fuzzy area of more energetic frequencies rather than a distinct tone.
- Bird songs appear as clearer, structured marks at higher frequencies—for example, the Fox Sparrow and Swainson's Thrush in this image.
- Mount Rainier National Park has an excellent overview of soundscapes and a well-labeled example spectrogram if you want to dive in a little bit deeper.
- More on reading spectrograms (LearnGala)
How does the National Park Service find these sounds?
As detailed above, the National Park Service collects acoustic data for monitoring and resource protection. As part of these efforts, data is annotated to highlight time periods when human noise events occur, usually by reviewing spectrograms visually. Data annotators do not listen to every minute of recorded audio—that would take far too long for the small cadre of folks working in this area.
However, while visually analyzing acoustic data for noise impacts, annotators discover all sorts of other sounds and may save audio clips of the most interesting ones to share with the world!
Given the thousands of hours of acoustic data that the park service collects, spectrograms are an essential tool for efficiently analyzing the data.
In some cases, computer vision techniques can be used to automatically classify events from the spectrogram, although there is not yet a generalized model for this. One of the most prominent examples of automated spectrogram parsing is Cornell's BirdNET tool , which analyzes spectrograms to classify bird song and is the algorithm that enables automatic bird ID in the popular Merlin app .
Share this website!
Scan the code below to open the site on a phone, or share the link: https://mertensia.github.io/alaska_acoustic_highlights/